| Copyright© by Barry Truax (Handbook for Acoustic Ecology). | ||
The term magnitude here can apply both to the scientist's desire to measure and quantify the physical "size" of the sound wave, and also to the listener's subjective evaluation of the loudness of the aural experience. Most analytical categories for sound treat it in the two dimensions of magnitude (which might be thought of as a dimension that varies in the time. The following section presents the concepts of magnitude in six sub-topics:
The scientists and acousticians commonly use four physical parameters to describe the magnitude of a sound wave, each of which can be translated into an equivalent of the others.
Amplitude focusses on the size of the particle vibration, and sound pressure on the force which such vibration exerts on the surrounding medium. The other two terms, intensity and power, place the emphasis on the more abstract notion of the "energy" of the wave, thereby relating it to other forms of energy transfer and exchange.
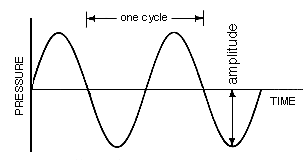
The maximum deviation from the average or equilibrium value of any repeatedly changing quantity, such as the position of a vibrating object, pressure, velocity, voltage, current and many others. The amplitude of a SOUND WAVE is the maximum amount by which the instantaneous SOUND PRESSURE differs from the AMBIENT pressure. See diagram under SIMPLE HARMONIC MOTION.
Two CYCLEs of a sine wave showing the amplitude of the pressure variation.
The variation of (maximum) amplitude over time is called the ENVELOPE of the sound.
Compare: INTENSITY, LOUDNESS, POWER, VOLUME. See also: DECAY TIME, OSCILLATION, PARTICLE VELOCITY, RISE TIME, ROOT MEAN SQUARE, SINE WAVE, THRESHOLD OF HEARING, TREMOLO, WAVEFORM.
The energy transmitted per unit time and area by a SOUND WAVE. The term is used generally to denote the magnitude of a sound. The measurement of intensity is called INTENSITY LEVEL (see DECIBEL).
See Appendix D for the conversion of intensity ratios to decibels, and SOUND INTENSITY for a fuller discussion.
Compare: AMPLITUDE, LOUDNESS, POWER, SOUND PRESSURE, VOLUME.
The sound energy transmitted per unit time through a unit area, thereby being a measure of the magnitude of a sound. The unit of measurement is the erg per second per square centimeter, or the watt per square meter. The THRESHOLD OF HEARING lies at 10-12 watts/m2, whereas the THRESHOLD OF PAIN is about 1 watt/m2.
The measurement of sound intensity is its INTENSITY LEVEL and is measured logarithmically in DECIBELs because of the wide range of intensities involved. See Appendix D for the conversion of intensity ratios to decibels.
Sound intensity is proportional to the square of the SOUND PRESSURE, which, being easier to measure, is more commonly used as a basis of sound measurement. Sound intensity in FREE FIELD situations varies inversely as the square of the distance from the sound source (see INVERSE-SQUARE LAW).
See: NOISE LEVEL, SOUND LEVEL, SOUND PRESSURE LEVEL, SOUND WAVE. Compare: AMPLITUDE, LOUDNESS, POWER, VOLUME, VU METER.
The total energy given out by a source, as distinct from its INTENSITY which is the energy crossing a unit area in a unit time. Power is the rate of doing work and is measured in watts. An example of work done by sound is the moving a microphone DIAPHRAGM or the TYMPANIC MEMBRANE of the ear. However, the ear is sensitive to the rate of energy it receives, and interprets it as LOUDNESS.
Sound, however, contains little absolute power; a voice speaking softly may produce as little as 10-12 watts of power. A trombone playing fortissimo produces about 6.4 watts. The energy of a 40-watt bulb falling on an area of 1 cm2 at a distance of 1 cm produces the same energy per second as 1500 bass voices singing fortissimo.
Compare: AMPLIFIER, AMPLITUDE, DYNAMIC RANGE, SOUND INTENSITY, SOUND PRESSURE, VOLUME.
Power level is measured in DECIBELs. See table below and Appendix D.
Power ratio |
Decibels |
Current or voltage ratio |
Decibels |
1 |
0 |
1 |
0 |
2 |
3.0 |
2 |
6.0 |
3 |
4.8 |
3 |
9.5 |
4 |
6.0 |
4 |
12.0 |
5 |
7.0 |
5 |
14.0 |
6 |
7.8 |
6 |
15.6 |
7 |
8.5 |
7 |
16.9 |
8 |
9.0 |
8 |
18.1 |
9 |
9.5 |
9 |
19.1 |
10 |
10 |
10 |
20 |
100 |
20 |
100 |
40 |
1,000 |
30 |
1,000 |
60 |
10,000 |
40 |
10,000 |
80 |
100,000 |
50 |
100,000 |
100 |
1,000,000 |
60 |
1,000,000 |
120 |
Table for conversion of power ratios to decibels.
In an electrical circuit, power equals the voltage times the current, as established by Ohm's Law. See also: ROOT MEAN SQUARE.
The total amount of acoustical energy radiated by a sound source per unit time, measured in watts.
See also: POWER, SOUND POWER LEVEL, Appendix D. Compare: INTENSITY, LOUDNESS, SOUND INTENSITY, SOUND PRESSURE.
The vast range of magnitudes of sound energy or pressure to which we are accustomed demands, first of all, that some conveniently usable scale be adopted whose smallest unit is meaningful in daily applications. The various so-called "level" measurement systems quantify magnitude on a logarithmic scale.
Secondly, the logarithmic nature of significant increases in magnitude needs to be considered, and finally, the need to make relative, not absolute, comparisons between magnitudes has to be included. The solution is the so-called "level" measurement whose unit is the decibel, the most commonly used unit for describing acoustic magnitude. See also Appendix D.
The level measurement systems mentioned in B) naturally lead into noise measurement systems, almost all of which are principally concerned with measuring the magnitude of noise, and community response to it.
The term most often used in measuring the magnitude of sound. It is a relative quantity in that it is the ratio between the actual SOUND PRESSURE and a fixed reference pressure. This reference pressure is usually that of the THRESHOLD OF HEARING which has been internationally agreed upon as having the value .0002 dynes/cm2.
SPL may be measured with a SOUND LEVEL METER weighted according to a specific frequency response pattern and termed SOUND LEVEL. The electroacoustic equivalent to SPL is measured with a VU METER.
Because the square of the sound pressure is proportional to SOUND INTENSITY, SPL can be calculated in the same manner and is measured in DECIBELs.
SPL = 10 log (r/rref)2 = 20 log (r/rref)
where r is the given sound pressure and rref is the reference sound pressure.
See: EQUIVALENT ENERGY LEVEL, INTENSITY LEVEL, ISOBEL, NOISE LEVEL, SOUND LEVEL, SOUND POWER LEVEL. Compare: HEARING LEVEL, LOUDNESS LEVEL, SPEECH INTERFERENCE LEVEL.
Two SPL measurements in decibels may be combined with the aid of the following chart. The difference in decibels between the two readings is found on the upper scale, and the corresponding correction appears opposite it on the lower scale. This correction is added to the higher SPL to give the combined measurement. Multiple readings may be combined by repeating this process.
For example, equal SPL readings (0 on top scale) produce a 3.0 increase when combined. A 5 dB difference (say between 60 and 65 dB) produces a 1.2 dB increase (a total of 66.2 dB for the same example). A 10 dB difference requires a 0.4 dB correction, and so on. Also see examples under DECIBEL, INVERSE-SQUARE LAW, Appendix D.
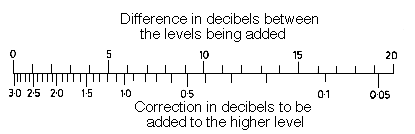
Scale for combining sound pressure levels.
The law by which the mean-square SOUND PRESSURE LEVEL varies inversely as the square of the distance from the source. The general rule of thumb is that, under ideal conditions (no reflecting surfaces or other background sound or interference), a sound level drops 6 dB for every doubling of the distance from the source. If the two distances in question are d1 and d2, then the decibel difference DD is:
DD = 10 log (d1/d2)2 = 20 log (d1/d2)
The table below can be used to find the correction for distance such as in the case of distances quoted in noise measurement specifications, assuming ideal conditions. Take the given distance on the left-hand column and find the correction in the vertical column under the distance for which the correction is desired. Add the correction to the given level to find the corrected level.
For a discussion of environmental effects, see SOUND PROPAGATION. Note that this table applies only to point sources and FREE FIELD conditions. See: SIMPLE SOUND SOURCE.
Corrected Distance (ft)
Given Distance (ft) |
3 |
5 |
10 |
15 |
20 |
25 |
30 |
40 |
50 |
60 |
70 |
80 |
90 |
100 |
3 |
0 |
- 4.4 |
-10.5 |
-14.0 |
-16.5 |
-18.0 |
-20.0 |
-22.5 |
-24.4 |
-26.0 |
-27.4 |
-28.5 |
-29.5 |
-30.5 |
5 |
4.4 |
0 |
- 6.0 |
- 9.5 |
-12.0 |
-14.0 |
-15.6 |
-18.1 |
-20.0 |
-21.6 |
-22.9 |
-24.1 |
-25.1 |
-26.0 |
10 |
10.5 |
6.0 |
0 |
- 3.5 |
- 6.0 |
- 8.0 |
- 9.5 |
-12.0 |
-14.0 |
-15.6 |
-16.9 |
-18.1 |
-19.1 |
-20.0 |
15 |
14.0 |
9.5 |
3.5 |
0 |
- 2.5 |
- 4.4 |
- 6.0 |
- 8.5 |
-10.5 |
-12.0 |
-13.4 |
-14.5 |
-15.6 |
-16.5 |
20 |
16.5 |
12.0 |
6.0 |
2.5 |
0 |
- 1.9 |
- 3.5 |
- 6.0 |
- 8.0 |
- 9.5 |
-10.9 |
-12.0 |
-13.1 |
-14.0 |
25 |
18.0 |
14.0 |
8.0 |
4.4 |
1.9 |
0 |
- 1.6 |
- 4.1 |
- 6.0 |
- 7.6 |
- 8.9 |
-10.1 |
-11.1 |
-12.0 |
30 |
20.0 |
15.6 |
9.5 |
6.0 |
3.5 |
1.6 |
0 |
- 2.5 |
- 4.4 |
- 6.0 |
- 7.4 |
- 8.5 |
- 9.5 |
-10.5 |
40 |
22.5 |
18.1 |
12.0 |
8.5 |
6.0 |
4.1 |
2.5 |
0 |
- 1.9 |
- 3.5 |
- 4.9 |
- 6.0 |
- 7.0 |
- 8.0 |
50 |
24.4 |
20.0 |
14.0 |
10.5 |
8.0 |
6.0 |
4.4 |
1.9 |
0 |
- 1.6 |
- 2.9 |
- 4.1 |
- 5.1 |
- 6.0 |
60 |
26.0 |
21.6 |
15.6 |
12.0 |
9.5 |
7.6 |
6.0 |
3.5 |
1.6 |
0 |
- 1.3 |
- 2.5 |
- 3.5 |
- 4.4 |
70 |
27.4 |
22.9 |
16.9 |
13.4 |
10.9 |
8.9 |
7.4 |
4.9 |
2.9 |
1.3 |
0 |
- 1.2 |
- 2.2 |
- 3.1 |
80 |
28.5 |
24.1 |
18.1 |
14.5 |
12.0 |
10.1 |
8.5 |
6.0 |
4.1 |
2.5 |
1.2 |
0 |
- 1.0 |
- 1.9 |
90 |
29.5 |
25.1 |
19.1 |
15.6 |
13.1 |
11.1 |
9.5 |
7.0 |
5.1 |
3.5 |
2.2 |
1.0 |
0 |
- 0.9 |
100 |
30.5 |
26.0 |
20.0 |
16.5 |
14.0 |
12.0 |
10.5 |
8.0 |
6.0 |
4.4 |
3.1 |
1.9 |
0.9 |
0 |
Decibel corrections for variations in distance from source. An example: a sound source of 60 dB is measured at 50 feet; if the measurement were at 15 feet, the level would be 60 + 10.5 = 70.5 dB under ideal conditions.
A unit of a logarithmic scale of power or intensity called the power level or intensity level. The decibel is defined as one tenth of a bel where one bel represents a difference in level between two intensities I1, I0 where one is ten times greater than the other. Thus, the intensity level is the comparison of one intensity to another and may be expressed:
Intensity level = 10 log10 (I1 /I0) (dB)
For instance, the difference between intensities of 10-8 watts/m2 and 10-4 watts/m2, an actual difference of 10,000 units, can be expressed as a difference of 4 bels or 40 decibels.
Because of the very large range of SOUND INTENSITY which the ear can accommodate, from the loudest (1 watt/m2) to the quietest (10-12 watts/m2), it is convenient to express these values as a function of powers of 10. This entire range of intensities can be expressed on a scale of 120 dB. (The physicist Alexander Wood once compared this range from loudest to quietest to the energy received from a 50 watt bulb situated in London, ranging from close by to that received by someone in New York.) See: DYNAMIC RANGE.
The result of this logarithmic basis for the scale is that increasing a sound intensity by a factor of 10 raises its level by 10 dB; increasing it by a factor of 100 raises its level by 20 dB; by 1,000, 30 dB and so on. When two sound sources of equal intensity or power are measured together, their combined intensity level is 3 dB higher than the level of either separately. Thus, two 70 dB cars together measure 73 dB under ideal conditions. However, note that when the AMPLITUDE of a single sound is doubled, its level rises 6 dB.
 Sound
Example: Ramp descending at 6 dB per event, followed by a ramp
descending at 3 dB.
Sound
Example: Ramp descending at 6 dB per event, followed by a ramp
descending at 3 dB.
0 dB is defined as the THRESHOLD OF HEARING, and it is with reference to this internationally agreed upon quantity that decibel measurements are made. In some situations, such as tape recording, a given intensity level is assigned 0 dB, and other levels are measured in negative decibels in comparison to it.
See: AUDIOGRAM, LEVEL RECORDER, VU METER, ZERO LEVEL VU. See also: HEARING LEVEL, LOUDNESS LEVEL, SOUND LEVEL, SOUND POWER LEVEL, SOUND PRESSURE LEVEL.
Decibels may be qualified as dBA, dBB, dBC, indicating the weighting network of the SOUND LEVEL METER with which the measurement was made. The term became accepted in the 1920s and since then noise measurement has generally come to rely on the decibel scale and others derived from it.
See: NOISE, NOISE LEVEL, NOISE RATING, NOISE & NUMBER INDEX, PERCEIVED NOISE LEVEL, TRAFFIC NOISE INDEX. Compare: EQUIVALENT ENERGY LEVEL.
These newer systems have brought environmental factors and frequency content to bear on the measurement of LOUDNESS. The PHON scale attempts to account for the subjective response of the ear to loudness, which is not possible with the decibel measurement of intensity. See also: EQUAL LOUDNESS CONTOURS.
See INVERSE-SQUARE LAW for variation of decibel measurement with distance, and SOUND PRESSURE LEVEL for scale according to which decibel measurements may be combined. Appendix D gives a conversion chart of voltage and power ratios to decibels.
| Threshold of hearing | 0 dB | Motorcycle (30 feet) | 88 dB | |
| Rustling leaves | 20 dB | Foodblender (3 feet) | 90 dB | |
| Quiet whisper (3 feet) | 30 dB | Subway (inside) | 94 dB | |
| Quiet home | 40 dB | Diesel truck (30 feet) | 100 dB | |
| Quiet street | 50 dB | Power mower (3 feet) | 107 dB | |
| Normal conversation | 60 dB | Pneumatic riveter (3 feet) | 115 dB | |
| Inside car | 70 dB | Chainsaw (3 feet) | 117 dB | |
| Loud singing (3 feet) | 75 dB | Amplified Rock and Roll (6 feet) | 120 dB | |
| Automobile (25 feet) | 80 dB | Jet plane (100 feet) | 130 dB |
Typical average decibel levels (dBA) of some common sounds.
Because the human ear discriminates against low frequencies (see EQUAL LOUDNESS CONTOURS), any measurement of the subjective response to SOUND PRESSURE must be adjusted to match the sensing characteristics of the ear. This weighted measurement of sound pressure is called 'sound level', as compared to SOUND PRESSURE LEVEL, which is an unweighted, objective measurement of sound pressure. Sound level is measured with a SOUND LEVEL METER.
See: INTENSITY LEVEL, NOISE LEVEL, PHON. Compare: HEARING LEVEL, LOUDNESS LEVEL, NOISE CRITERION, NOISE RATING, PERCEIVED NOISE LEVEL, SOUND POWER LEVEL, SPEECH INTERFERENCE LEVEL, VOLUME.
An instrument for measuring the level of sound pressure in DECIBELs. Such measurements are called sound level readings. See: SOUND LEVEL.
Sound level meters usually contain different weighting networks (designated A, B, C, D) to discriminate against different frequencies. The very low frequencies are discriminated against quite severely by the A network, in a manner similar to the response of the ear (see EQUAL LOUDNESS CONTOURS), but only moderately by the B network and hardly at all by the C network. Therefore, if the measured sound level on the C network is much higher than that on the A network, much of the sound energy is concentrated in the low frequency region (see INFRASONIC).
Since the A weighting network corresponds to the tendency of the ear to discriminate against low frequency sounds, it is often employed in decibel measurements of community noise. Such measurements are designated dBA (see NOISE LEVEL). The sound level meter, however, does not take into account the predominant frequency region of the noise, or other factors which may cause annoyance.
Compare: COMMUNITY NOISE EQUIVALENT LEVEL, EQUIVALENT ENERGY LEVEL, NOISE POLLUTION, NOISE RATING, NOISE AND NUMBER INDEX, PERCEIVED NOISE LEVEL, SOUND INTRUSION, SOUND POLLUTION. Compare also: LEVEL RECORDER, SOUND ANALYSER, VU METER.
SPL readings (see SOUND PRESSURE LEVEL) refer to readings taken with a FLAT response network (i.e. unweighted level). In most cases, the C-scale readings will closely approximate the SPL value. Historically, the A, B, and C weighting networks were derived as the inverse of the 40, 70 and 100 dB EQUAL LOUDNESS CONTOURS, respectively, of Fletcher and Munson (1933). That is, the A network was to be used to measure low level sounds, the B for medium level and the C for high level. This distinction has been largely abandoned with a tendency to standardize to dBA measurements as a single number evaluator for noise.
When sounds have a similar frequency distribution of energy, dBA measurements may be used for ranking subjective responses to the sounds. When the sounds have very different energy distributions, or when there is a frequency dependence involved, such as with SOUND INSULATION or other noise control, then an analysis of the frequency distribution of the sound energy is required (see PERCEIVED NOISE LEVEL). In certain cases, average differences between PNL and dBA are commonly found, for instance, a 12 dB difference for jet aircraft, 13 dB for office noise.
A sound level meter will usually have fast and slow response modes indicating its sensitivity to rapid fluctuations and peak values of sound pressure. For a discussion of the measurement of peak and impulse levels, and their danger, see DAMAGE-RISK CRITERIA.
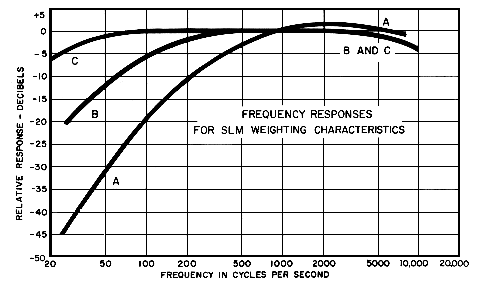
Sound level meter response characteristics for the A, B, and C weighting networks (from Handbook of Noise Measurement, General Radio, 1963, p. 9, used by permission).
Frequency |
Curve A |
Curve B |
Curve C |
Hz |
dB |
dB |
dB |
16 |
-56.7 |
-28.5 |
- 8.5 |
31.5 |
-39.4 |
-17.1 |
- 3.0 |
63 |
-26.2 |
- 9.3 |
- 0.8 |
125 |
-16.1 |
- 4.2 |
- 0.2 |
250 |
- 8.6 |
-1.3 |
0 |
500 |
- 3.2 |
- 0.3 |
0 |
1000 |
0 |
0 |
0 |
2000 |
1.2 |
- 0.1 |
- 0.2 |
4000 |
1.0 |
- 0.7 |
- 0.8 |
8000 |
- 1.1 |
- 2.9 |
- 3.0 |
16000 |
- 6.6 |
- 8.4 |
- 8.5 |
The measure of the average AMBIENCE of an environment over a given period of time in DECIBELs. See NOISE CRITERION and the L90 definition under NOISE LEVEL.
See also: REVERBERATION, SOUND SIGNAL, STANDING WAVES. Compare: PEAK LEVEL.
The maximum instantaneous SOUND PRESSURE LEVEL over a given duration measured in DECIBELs. See the L10 definition under NOISE LEVEL.
Compare: AMBIENT NOISE LEVEL. See: DAMAGE-RISK CRITERIA, IMPACT SOUND.
The measurement of the INTENSITY of a sound in comparison to another sound or fixed level as expressed in DECIBELs.
See: INVERSE-SQUARE LAW, SPECTRUM, THRESHOLD OF HEARING, THRESHOLD OF PAIN. Compare: HEARING LEVEL, LOUDNESS LEVEL, NOISE LEVEL, PERCEIVED NOISE LEVEL, SOUND INTENSITY, SOUND LEVEL, SOUND POWER LEVEL, SOUND PRESSURE LEVEL.
The level of SOUND POWER, in reference to 10-12 watts, measured in DECIBELs, and averaged over a period of time.
Compare: EQUIVALENT ENERGY LEVEL, INTENSITY LEVEL, LOUDNESS LEVEL, SOUND LEVEL, SOUND PRESSURE LEVEL.
The square root of the average of the squares of a variable quantity.
In terms of voltage, the root mean square voltage is called the effective voltage, as opposed to the peak voltage which corresponds to the maximum AMPLITUDE of the voltage variations. RMS power (in watts) is similarly called the effective power, since for an AMPLIFIER, for instance, it represents its real POWER. See: SOUND PRESSURE.
The following relationships hold between peak, rms and average voltage. Note that the so-called peak-to-peak voltage is twice the peak voltage.
| rms voltage = 0.707 peak voltage | rms voltage = 1.11 average voltage |
| peak voltage = 1.414 rms voltage | peak voltage = 1.57 average voltage |
| average voltage = 0.637 peak voltage | average voltage = 0.9 rms voltage |
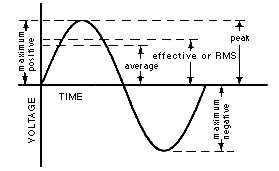
Relative levels of average, RMS and peak voltages in a sine wave signal.
Although people react to the magnitude of a sound quite subjectively, particularly when they are judging whether or not that magnitude is acceptable or appropriate to a given situation, it is still possible to quantify the auditory system's reaction to the magnitude of a stimulus (properly called "loudness") through theory and experiment. The problem is a classic one in psychophysics: to relate subjective sensation to the magnitude of the physical stimulus which causes the sensation.
See also Appendix F.
The subjective impression of the intensity or magnitude of a sound. It is dependent on FREQUENCY, WAVEFORM and duration, as well as SOUND INTENSITY or SOUND PRESSURE. It is expressed quantitatively in units of SONEs and PHONs for SINE TONEs or narrow band noise, and in terms of PERCEIVED NOISE LEVEL (PNdB) for broad band environmental sounds.
See also: DECIBEL, DYNAMICS, DYNAMIC RANGE, EQUAL LOUDNESSS CONTOURS, HYPERACUSIS, LOUDNESS LEVEL, NOISE, POWER, SOUND LEVEL METER. Compare: VOLUME.
Even for fairly simple sounds composed of sinusoidal components (called COMPLEX TONEs), the measurement of loudness is very difficult; however, the Stevens method of loudness summation is perhaps the most useful. See Appendix F.
The MASKing effect that one tone has on another, particularly one of higher frequency, making it harder to hear, complicates most cases, although for sinusoids, this is less serious when heard in rooms rather than with headphones. The presence of BEATS between closely spaced components of two sounds tends to enhance their loudness. However, when the components lie within a CRITICAL BANDWIDTH, the total loudness is the same as a single sine tone with equal SPL. For tones further apart than a critical band, the loudness contributions of each component (in sones) will add together.
The loudness of short sounds will tend to fall off below a duration of half a second. That is, to sound equally loud as longer sounds, short ones must be more intense. See: CLICK.
Exposure to constant tones results in a decrease in their apparent loudness, described as ADAPTATION of the ear. Constant exposure to moderate or intense NOISE levels leads to a temporary THRESHOLD SHIFT, which is experienced as a loss of sensitivity after the stimulus is removed.
The brain cannot fully react to extremely short, intense IMPACT SOUNDs or those which contain impulses of shorter duration than the brain's averaging time (35 ms). Therefore, although these sounds are not heard as loudly as their energy content would suggest, the full impact of the sound reaches the inner ear with consequent danger of hearing loss. See: DAMAGE-RISK CRITERIA.
The loudness level of a sound is measured by making a subjective comparison between the LOUDNESS of the sound and that of a PURE TONE of specified frequency that seems equally loud. The SOUND PRESSURE LEVEL of the pure tone in PHONs is then called the loudness level of the sound.
See: EQUAL LOUDNESS CONTOURS. Compare: HEARING LEVEL, NOISE LEVEL, PERCEIVED NOISE LEVEL, SOUND LEVEL, SOUND POWER LEVEL.
A unit used to describe the LOUDNESS LEVEL of a given sound or noise. The system is based on EQUAL LOUDNESS CONTOURS, where 0 phons at 1,000 Hz is set at 0 decibels, the THRESHOLD OF HEARING at that frequency (see graph). The hearing threshold of 0 phons then lies along the lowest equal loudness contour. If the intensity level at 1,000 Hz is raised to 20 dB, the second curve is followed.
It will be noted, therefore, that the relationship between the decibel and phon scale at 1,000 Hz is exact, but because of the way the ear discriminates against or in favour of sounds of varying frequencies, the phon curve varies considerably. For instance, a very low 30 Hz RUMBLE at 110 decibels is perceived as being only 90 phons (see graph); for its effect, however, see INFRASONIC.
Compare: SOUND LEVEL, VOLUME.
It is important to realize that the phon is used only to describe sounds that are equally loud. It cannot be used to measure relationships between sounds of differing loudness. For instance, 40 phons is not twice as loud as 20 phons. In fact, an increase of 10 phons is sufficient to produce the impression that a SINE TONE is twice as loud.
For the purpose of measuring sounds of different loudness, the SONE scale of subjective LOUDNESS was invented. One sone is arbitrarily taken to be 40 phons at any frequency, i.e. at any point along the 40 phon curve on the graph. Two sones are twice as loud, e.g. 40 + 10 phons = 50 phons. Four sones are twice as loud again, e.g. 50 + 10 phons = 60 phons. The relationship between phons and sones is shown in the chart, and is expressed by the equation:
Phon = 40 + 10 log2 (Sone)
which is analogous to the relation between PNdB and the NOY. See: PERCEIVED NOISE LEVEL.
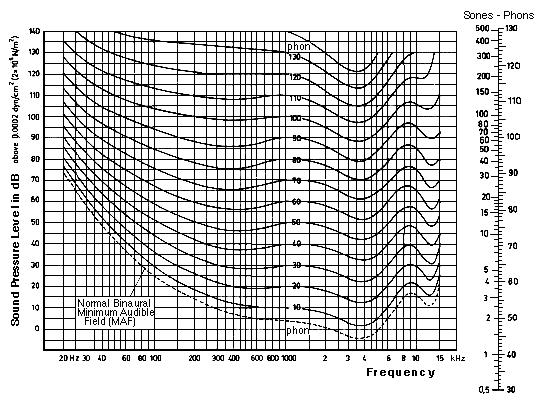
Equal loudness contours for pure tones and normal threshold of hearing for persons aged 18-25 years, using free-field hearing (from ISO recommendation R226).
A unit to describe the comparative LOUDNESS between two (or more) sounds. One sone has been arbitrarily fixed at 40 PHONs at any frequency, i.e. at any point along the 40 phon curve on the graph.
Since laboratory testing has shown that a difference of ten phons is sufficient to produce the impression that a sound is twice as loud, two sones are 50 phons. Four sones are twice as loud again, viz. 60 phons (see scale). A chart such as that shown here can be used for general conversion from phons (or DECIBELs) to sones for PURE TONEs.
For loudness summation of complex tones see LOUDNESS and Appendix F. See also: EQUAL LOUDNESS CONTOURS. Compare: MEL, PERCEIVED NOISE LEVEL, VOLUME.
Equal loudness contours for pure tones and normal threshold of hearing for persons aged 18-25 years, using free-field hearing (from ISO recommendation R226).
Strictly speaking, dynamics refer to the variations in LOUDNESS of a musical composition or specific NOTEs.
Compare: DYNAMIC RANGE, VOLUME.
The most common dynamic markings, from quietest to loudest, are the following:
pp |
pianissimo (very soft) |
p |
piano (soft) |
mp |
mezzo-piano (medium soft) |
mf |
mezzo-forte (medium loud) |
f |
forte (loud) |
ff |
fortissimo (very loud) |
These terms have no absolute values and are relative to one another according to the context of the music. Changes in dynamic levels are indicated as follows:
cresc. crescendo (increasing loudness)
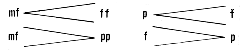
decresc. decrescendo (decreasing loudness)
In ELECTROACOUSTIC applications, the term dynamic refers to time-dependent behaviour, such as the motion of a dynamic MICROPHONE, or the time-dependence of dynamic filtering or spatial modulation.
The psychological measure of the magnitude of a SOUND or SOUND OBJECT including its SPECTRUM (frequency and intensity), harmonic content, duration and spatial properties.
Although volume increases directly with INTENSITY and is colloquially identified with it, it will also be affected by REVERBERATION and RESONANCE, as well as by the presence of OVERTONEs or PARTIALs. An increase or decrease in any of these will affect the total perceived volume of a sound or sound environment. Multiple sources that are similar, such as in a choral ensemble, also enhance the volume of the resultant sound. See: BLEND.
What might be called the 'constancy of volume' helps the auditory system resolve any ambiguity in LOUDNESS and distance, such as that between a distant loud sound and a softer nearby one. Acoustic sounds tend to retain their identity and sense of magnitude, regardless of distance or intensity level. In contrast, the PARAMETERs of electroacoustic sounds may be varied independently, such as when a FADER changes the loudness of a sound without affecting its overall spectrum.
Compare: AMPLITUDE, DYNAMICS, DYNAMIC RANGE, MASS, POWER, SONE, SONORITY, SOUND INTENSITY, SOUND LEVEL, SOUND PRESSURE, TIMBRE.
Sound
Example: Two examples of shipbuilding, the first with hammering on a
wooden hull in a small room, the second on a steel hull in a large space. Both
examples are played with approximately the same sound intensity level but differ
considerably in the volume of the sound.
Tthe concept of "threshold" is central to all psychophysics. It specifies minimally perceptible changes, sometimes called "Just noticeable differences" of a stimulus, or alternatively, the magnitude of a stimulus that is just barely noticeable in the first place. It is significant with sound that this latter threshold constantly changes with environmental conditions. Hearing sensitivity is constantly changing, not only because our attentiveness changes, but also because our basic hearing changes with noise levels, as described by the term "threshold shift". Another use of the term "threshold" is to describe the onset of limiting subjective reactions, namely discomfort and pain.
The difference in SOUND PRESSURE LEVEL between the saturation or overload level and the BACKGROUND NOISE level of an acoustic or electroacoustic system, measured in DECIBELs. This RANGE may be expressed as a SIGNAL-TO-NOISE RATIO for maximum output. Compare: GAIN.
For a sound or a signal, its dynamic range is the difference between the loudest and quietest portions.
Compare: LOUDNESS, POWER, VOLUME.
The human hearing system has a dynamic range of about 120 dB between the THRESHOLD OF HEARING and THRESHOLD OF PAIN. See: RECRUITMENT.
The dynamic range of music may approach 90 dB, and since the maximum range is 55-60 dB for analog tape, and often less for disc recordings and optical soundtracks, COMPRESSION is necessary in the recording of such signals. Noise reduction and companding equipment are designed to increase the dynamic range by 10-20 dB or more. The dynamic range of DIGITAL RECORDING is generally over 90 dB.
See also: LIMITER, LINEAR, SOUND SYNTHESIS, VU METER. Compare: DYNAMICS, silence.
The INTENSITY LEVEL where a sound becomes just audible. For a continuous tone of between 2000 and 4000 Hertz, heard by a person with good hearing acuity under laboratory conditions, this is 0.0002 dyne/cm2 SOUND PRESSURE and is given the reference level of 0 dB.
In terms of AMPLITUDE, the EARDRUM moves about 0.000000001 cm, much less than the wavelength of light. If the ear were any more sensitive it would detect the random movements of air molecules. While 0 dB is the reference employed, the threshold of hearing varies considerably with lower and higher frequencies (see graph of EQUAL LOUDNESS CONTOURS or PHON). Also called minimum audible field (MAF).
See: AUDIOGRAM, BONE CONDUCTION HEARING LEVEL, DECIBEL, DYNAMIC RANGE, HEARING LEVEL, MASKING, SOUND INTENSITY, SOUND PRESSURE LEVEL, THRESHOLD SHIFT. Compare: THRESHOLD OF PAIN, VU METER, ZERO LEVEL VU.
Alternate units for this reference level are: 2 x 10⁻⁴ microbar (µbar); 2 x 10⁻⁵ Newton/m2 (N/m2); 2 x 10⁻⁵ Pascal (Pa); 20 micropascal (µPa).
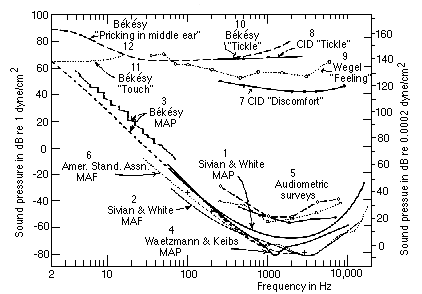
Determination of the threshold of audibility and the threshold of feeling. Curves 1 to 6 represent attempts to determine the absolute threshold of hearing at various frequencies by the authors listed. MAP = minimum audible pressure at the eardrum; MAF = minimum audible pressure in a free sound field, measured at the place where the listener's head had been. Curves 7 to 12 represent attempts to determine the upper boundary of the auditory realm, beyond which sounds are too intense for comfort, and give rise to nonauditory sensations of tickle and pain. From: Licklider, Handbook of Experimental Psychology, S.S. Stevens, ed., 1951, p. 995, used by permission.
The just noticeable difference (jnd) in any parameter, such as PITCH, LOUDNESS and duration. Also called the difference limen. As can be seen in the graphs below, each of these depends on the frequency range and intensity level of the tone with respect to which the difference can be detected.
In general, the ear is most sensitive to slight changes in the range of 1 to 4 kHz and this sensitivity increases with intensity. For the dependence on duration see CLICK. The results quoted below are obtained under laboratory conditions with PURE TONEs, whereas in practice with complex tones, the individual's sensitivity will depend on training, environmental factors and hearing loss.
See also: CRITICAL BANDWIDTH, MINIMUM AUDIBLE ANGLE. Compare: PERFECT PITCH.
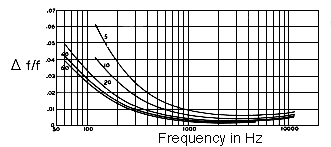
The variation of Df / f with frequency f, where Df is the minimum perceptible frequency change. Numbers on the curve indicate levels above the threshold of hearing (from Olson, Music, Physics and Engineering, Dover, 1967, p. 248, after Shower and Biddulph, used by permission).
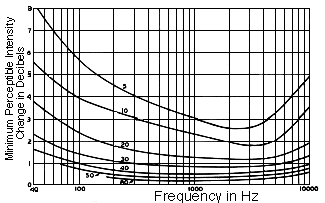
The minimum perceptible change in intensity level of pure tones as a function of frequency. Numbers on the curves indicate level above threshold (from Olson, Music, Physics and Engineering, Dover, 1967, p. 254, used by permission).
On exposure to NOISE, the ear's sensitivity level will decrease as a measure of protection. This process is referred to as a shift in the THRESHOLD OF HEARING, meaning that only sounds louder than a certain level will be heard. The shift may be temporary, chronic or permanent.
Susceptibility to TS varies greatly from person to person, men generally being more sensitive to low frequency sounds, and women more susceptible to high frequencies. Sounds in the 2 - 6 kHz range seem to induce greater temporary threshold shift (TTS) than other frequencies. Also called aural fatigue. Compare: ADAPTATION.
One of the body's reactions to loud sounds is a constriction of the blood vessels (vasoconstriction) which reduces the blood supply reaching the hair cells of the ORGAN OF CORTI. The outer rows of hair cells respond mainly to low intensity sound levels and thus are easily saturated by loud sounds, particularly when their source of blood is diminished. This leaves only the inner rows of hair cells working since they need a higher intensity for stimulation.
Thus, TTS implies a temporary HEARING LOSS for low level sounds (somewhat analogously to the protective closing of the iris in bright light and the resulting temporary desensitization to low light levels). If the outer hair cells are not allowed to recover through periods of quiet, they gradually lose their ability to respond and eventually die. TTS may also be accompanied by TINNITUS, a ringing in the ears. See also: RECRUITMENT.
Compare: BOILERMAKER'S DISEASE, DAMAGE-RISK CRITERIA, HEARING LEVEL, HYPERACUSIS, IMPACT SOUND, LOUDNESS, MASKING, NOISE POLLUTION, OCCUPATIONAL DEAFNESS.
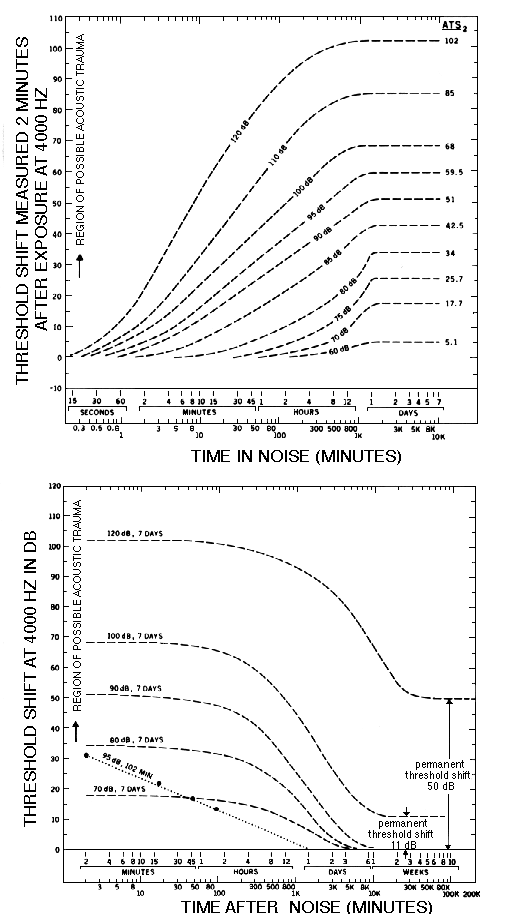
Hypothetical growth and recovery of threshold shift after various single and continuous exposures to noise centred near 4 kHz ("worst case" condition). These hypothetical curves are for average, normal-hearing young adults, and are based on all available data (from Miller, "Effects of Noise on People", Journal of the Acoustical Society of America, vol. 56, 1974, p. 734-5, used by permission).
The INTENSITY LEVEL of a loud sound which gives pain to the ear, usually between 115 and 140 dB (see graph). For some listeners with HYPERACUSIS these levels may be much lower.
At lower levels occur the threshold of feeling (or tickle) and the threshold of discomfort. It has been stated that this latter threshold "rises substantially with increasing habituation ... naive listeners reach a limit about 125 dB SPL and experienced listeners at 135 to 140 dB." (Edwin B. Newman, "Speech and Hearing," in American Institute of Physics Handbook, 3rd edition, p. 3-155.) Most audiologists agree however that no unprotected ear should ever be exposed to 135 dB sound.
See: ACOUSTIC TRAUMA, DAMAGE-RISK CRITERIA, DYNAMIC RANGE, SOUND INTENSITY. Compare: THRESHOLD OF HEARING, VU METER.
Determination of the threshold of audibility and the threshold of feeling. Curves 1 to 6 represent attempts to determine the absolute threshold of hearing at various frequencies by the authors listed. MAP = minimum audible pressure at the eardrum; MAF = minimum audible pressure in a free sound field, measured at the place where the listener's head had been. Curves 7 to 12 represent attempts to determine the upper boundary of the auditory realm, beyond which sounds are too intense for comfort, and give rise to nonauditory sensations of tickle and pain. From: Licklider, Handbook of Experimental Psychology, S.S. Stevens, ed., 1951, p. 995, used by permission.
The process by which the ear's sensitivity to sound is changed by the presence of a constant sound or DRONE. The state of fatigue caused by such a load on the sensory cells and nerve fibres results in a gradual decrease in the apparent LOUDNESS of a constant tone or noise. In the following diagrams, it can be seen how a SINE TONE decreases in apparent loudness over a three minute period; a similar effect occurs when one is exposed to loud sounds. Also called aural fatigue or habituation.
Compare: HEARING LOSS, MASKING, THRESHOLD SHIFT.

Decrease of loudness sensation through fatigue when the ear is taxed with a permanent sine wave, measured over 3 minutes. Hatched area shows time course of the signal for three cases: a) constant sound pressure; b) doubling of the pressure after 2 minutes; c) halving of the pressure after 2 min. (from F.Winckel, Music, Sound and Sensation, Dover, 1967, p. 104, used by permission).
Since all sounds have their own "lifetime", as it were, being born, sustaining their energy, and finally dying away, a set of terms has evolved to describe how a sound's magnitude changes over time, most commonly called its "envelope". With constant or near-constant sounds, statistical methods need to be invoked to describe the time dependence.
The shape of a sound's AMPLITUDE in time. Graphical representation of the envelope of a sound object may show distinctive features in its ATTACK or onset TRANSIENTs, STATIONARY STATE, INTERNAL DYNAMICS and DECAY.
Envelope generators are used in ELECTRONIC MUSIC and SOUND SYNTHESIZERs.
The envelope of a sounds is its macro-level amplitude behaviour in time, whereas its micro-level pattern of SOUND PRESSURE variation is its WAVEFORM.
Compare diagrams under COMPRESSION, DRONE, STATIONARY SOUND.
For spectral envelope see FREQUENCY RESPONSE and SPECTRUM.
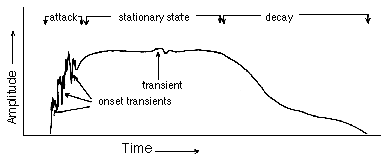
Generalized sound envelope showing distinctive features.
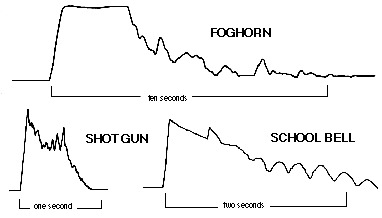
Graphic level pattern of recorded sounds made with a LEVEL RECORDER, showing characteristic envelopes which include environmental reverberation during the decay portion.
Sound
Example: Foghorn, Fort Amherst, Newfoundland.
Sound Example: Shotgun blast, Alberta.
Sound Example: School bell, Alberta.
The initial part of a sound, from its onset to the point where its AMPLITUDE reaches a maximum.
See: CLICK, PULSE, TRANSIENT, diagrams under ENVELOPE, FOURIER ANALYSIS. Compare: DECAY, RISE TIME, STATIONARY STATE.
The attack characteristics of many sounds in the contemporary environment have changed significantly from their older counterparts, often as a result of their electroacoustic production. For example, the electronic triggering of emergency warning signals results in a very fast attack time, whereas earlier devices were constrained by mechanical inertia. See also: IMPACT SOUND.
In acoustics, the time required for an OSCILLATION to reach its maximum AMPLITUDE.
See: ATTACK, ENVELOPE, IMPACT SOUND. Compare: DAMPING, DECAY TIME, RATE OF DECAY, TRANSIENT.
The process whereby the AMPLITUDE of OSCILLATION of a vibrating system diminishes with time due to a loss in energy. In terms of the ENVELOPE of a sound, it refers to the final part of the sound, including effects of REVERBERATION.
Compare: ATTACK, ATTENUATION, DAMPING, STATIONARY STATE. See: DECAY TIME, RATE OF DECAY, diagram under ENVELOPE.
The time required for the AMPLITUDE of a vibrating system to decrease to approximately 37% (or 1/e) of its initial value. For a system with a constant rate of DAMPING, the DECAY is exponential and the decay time is independent of the initial amplitude.
Compare: ATTACK, RATE OF DECAY, RISE TIME.
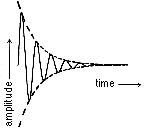
Exponential damping of a sine wave. Dashed line indicates exponential decay of the amplitude.
The speed at which the DECAY takes place, usually expressed in DECIBELs per second.
See: DECAY TIME. Compare: DAMPING, REVERBERATION, RISE TIME.
The loss of energy in a system due to friction (internal or external) or other resistance. The resulting decrease in AMPLITUDE of the system is known as the DECAY.
The term damping, then, is restricted to the system itself, rather than to the sound of the system in an environment where the word 'decay' can refer to the effect of REVERBERATION, i.e. to the decrease in acoustical energy in an enclosed space.
See: DECAY TIME, RATE OF DECAY. Compare: ABSORPTION, ATTENUATION, RESONANCE, RISE TIME, VIBRATION.
Exponential damping of a sine wave. Dashed line indicates exponential decay of the amplitude.
That portion of the ENVELOPE of a sound or SOUND OBJECT when its AMPLITUDE is relatively unchanging, that is, the portion between the end of its ATTACK and the beginning of its DECAY, usually heard as stationary, i.e. more or less unchanging. Also called steady state.
However, unless the sound is produced electronically, for instance by an OSCILLATOR with a fixed WAVEFORM, the SPECTRUM of the sound will show subtle variations (see diagram under FOURIER ANALYSIS).
Compare: DRONE, HUM, INTERNAL DYNAMICS, STATIONARY SOUND.
The variations in intensity of the middle portion of the ENVELOPE of a SOUND OBJECT, between its ATTACK and DECAY. These internal dynamics may remain nearly stationary in simple sounds, or in complex sounds may include secondary attacks, growths and decays between the initial attack and the final decay.
See: GRAIN, STATIONARY SOUND, STATIONARY STATE, TRANSIENT. Compare: DRONE, HUM, MODULATION, STOCHASTIC PROCESS.
Sound
Example: Power line hum with internal dynamics.
Sound Example: Spinning wheel.
A sound or SOUND OBJECT whose AMPLITUDE is relatively unchanging. However, in any natural sound the SPECTRUM is always changing (see diagram under FOURIER ANALYSIS) and there are usually slight fluctuations in amplitude even in what appears to be a steady sound.
Mechanical or electrical sounds (e.g. HUMs) are usually examples of stationary sound that are almost completely unchanging. They may be called flatline sounds or DRONEs because of their steadiness.
Compare: ENVELOPE, GRAIN, INTERNAL DYNAMICS, REDUNDANCY, STANDING WAVES, STATIONARY STATE, TAPE LOOP, TEMPO, TRANSIENT.
Many similar sound sources, or a single sound source with many components, will combine to produce an aggregate texture that may be called quasi-stationary or quasi-continuous sound. The individual ATTACK and DECAY of the separate components cannot be distinguished, except as fluctuations of the continuous texture. Distant surf and traffic are examples of this type of sound, as shown in the level recordings below.
Compare: AMBIENCE, STOCHASTIC PROCESS.
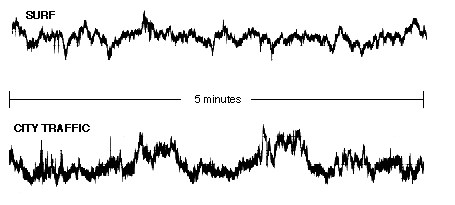
ENVELOPEs of quasi-stationary complex sounds.
Sound
Example: Surf, along the Newfoundland coast.
Sound Example: City traffic, Ottawa, Ontario.
A sound with a very sharp ATTACK, by analogy to the collision of an object in motion with another object at rest or in motion. Also called impulse sound.
Compare: CLICK, PULSE, TRANSIENT.
For sounds of intensity 75 - 90 dBA, the ear has a protective mechanism to reduce its sensitivity to low frequency impact sounds by changing the mode of oscillation of the bone structure in the MIDDLE EAR (see OSSICLES). However, a delay of 300 to 500 milliseconds is required to set this protection fully in operation (compare THRESHOLD SHIFT). Most naturally occurring impact sounds have longer RISE TlMEs, and thus the ear can easily cope with them, but many man-made sounds, such as explosions from artillery or guns, as well as certain industrial noises, can have such sharp attacks that the ear's protective mechanism cannot respond quickly enough. The HEARING LOSS caused by such sounds is permanent. ACOUSTIC TRAUMA and related damage suffered by soldiers in wartime is called shell-shock.
See: RECRUITMENT, TRANSIENT RESPONSE.
The PEAK LEVEL of an impact sound may be measured with the fast response mode of a SOUND LEVEL METER. For further discussion see DAMAGE-RISK CRITERIA. Impact sounds may also be analysed with an IMPACT NOISE ANALYSER.
See: IMPACT INSULATION CLASS, SOUND INSULATION.
Sound
Example: Shotgun blasts.
Sound Example: Footsteps on a wooden floor.
A sudden and brief fluctuation in a sound. The sound of a crack on a record, for example.
See: CLICK, ENVELOPE, TRANSIENT RESPONSE, WAVEFORM. Compare: GRAIN, IMPACT SOUND, PULSE.
In the initial part of any sound there occur a number of these fluctuations, for instance, the moment a violinist puts the bow to the string or the trumpeter tongues the notes. These are called onset transients and are important in identifying the sound source and its spatial location and TIMBRE. If these are SPLICEd out of a recording of the sound, it will easily be confused with other sounds.
See diagram under FOURIER ANALYSIS and FOURIER SYNTHESIS.
A linguistic example of transients is the initial CONSONANT in words such as: till, pill, kill, bill. The lack of intelligibility of speech in spaces with long REVERBERATION times (see DIFFUSE SOUND FIELD) is mainly due to the MASKing of such transients by reflected sound. Since onset transients often include high frequency components, loss of hearing sensitivity in this range (PRESBYCUSIS) results in decreased ability to distinguish between similar sounds or syllables. Compare: RESIDUE.
A transient sound is one whose average properties change in time such as a passing car, a SONIC BOOM, or an aircraft flying over.
Compare: INTERNAL DYNAMICS, STATIONARY SOUND.
The magnitude of an audio signal can be described in much the same way as that of an acoustic sound wave. The important difference is that in the electroacoustic case, the magnitude can and must be controlled, varied and manipulated. In some cases, the control is required because of the limitations of the medium itself, in other cases, because of design considerations in producing an acceptable product, whereas in others, outright manipulation of acoustic environments may be involved.
Any device used to increase the magnitude of an input SIGNAL. Electroacoustical amplifiers are rated in terms of their POWER in watts.
Compare: ATTENUATOR, LIMITER, RESONATOR, RECEIVER, TRANSDUCER. See also: AMPLIFICATION, FEEDBACK, FLAT, GAIN, HELMHOLTZ RESONATOR, ROOT MEAN SQUARE, VU METER.
The process of producing an increase in the energy of a sound or an AUDIO SIGNAL. This may be accomplished by means of an electronic AMPLIFIER, or by means of an acoustic RESONATOR, such as the sound box of a musical instrument, an ear-trumpet, etc. Attaching (i.e. coupling) a vibrating object to another surface, such as a SOUNDBOARD, wall or floor, will result in a more efficient transfer of energy, and hence this process may also be termed amplification.
Amplification or GAIN may be measured in DECIBELs.
See: ACOUSTIC IMPEDANCE, ACOUSTIC RADIATION, RESONANCE. Compare: ATTENUATION.
Colloquially, AMPLIFICATION. Technically, the ratio of the output of a system such as an AMPLIFIER to its input. It may be expressed as a simple arithmetical ratio or in DECIBELs.
Determining the record or playback levels on a tape recorder is often called gain adjustment.
See: FADER, LIMITER, PEAK CLIPPING, POTENTIOMETER. Compare: DYNAMIC RANGE, SIGNAL-TO-NOISE RATIO, VU METER.
Reduction in magnitude of a physical quantity such as sound, either by electronic means (e.g. a FADER, ATTENUATOR or POTENTIOMETER on a mixer, or the volume control adjustment of an AMPLIFIER), or by a physical barrier, including various absorptive materials (see ABSORPTION COEFFICIENT). Attenuation is usually measured in DECIBELs. See also: FILTER.
Compare: ABSORPTION, AMPLIFICATION, COMPRESSION, DAMPING, FADE, GAIN, RESONANCE, SOUND INSULATION.
VU is an abbreviation for volume unit. Thus, a VU meter is a device for measuring the level of SOUND INTENSITY with audio equipment, such as AMPLIFIERs and TAPE RECORDERs.
Although the measurements indicated on such a meter are in DECIBELs, the zero level should not be confused with 0 dB, the THRESHOLD OF HEARING. On such meters, zero indicates the maximum DISTORTION-free level that can be handled by the device with other values greater or less than the zero level indicated as positive and negative decibels relative to it respectively. See: ZERO LEVEL VU.
In practice, analog devices have considerable headroom above 0 VU to allow for peak levels; DIGITAL RECORDING systems, on the other hand, have little or no headroom because of their fixed DYNAMIC RANGE which is usually larger than with analog systems.
The diagram below shows a VU meter with a decibel scale from -20 to +3 dB, and a linear percentage of MODULATION scale from 0 to 100% below it. A meter which is linear in decibels (rather than percentage of modulation) is called a peak programme meter (PPM), and is commonly used in Britain.
Compare: GAIN, LEVEL RECORDER, OSCILLOSCOPE, SIGNAL-TO-NOISE RATIO, SOUND LEVEL METER, SOUND PRESSURE LEVEL.
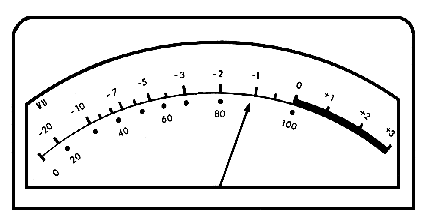
VU meter where levels above 0 VU are shown as positive decibels (the range of potential distortion), and those below it as negative decibels.
A reference power level shown on a VU METER. Although 0 VU is shown on a VU meter as the point of 100% MODULATION, it is not identical to the reference called zero level, which in fact refers to -4 dB or -4 VU on the meter.
Zero level is the reference level obtained with a 1000 Hz signal and 1 milliwatt of power in a line or circuit of 600 ohms resistance (a 600-ohm line). The corresponding voltage level is 0.773 volts. This level is sometimes called 0 dbm. Other levels may be described in reference to it; for instance, 0 VU is +4 dbm and represents a voltage level of 1.228 volts.
Compare: DECIBEL, THRESHOLD OF HEARING.
The control of sound levels to ensure suitable placement between the lowest and highest distortion-free levels of an electroacoustical system.
See: DYNAMIC RANGE. Compare: LIMITER, PEAK CLIPPING, RECTIFICATION.
Compression may be thought of as a form of non-LINEAR amplification where peak levels above a certain threshold are amplified according to input-to-output ratios such as 2:1, 3:1, 5:1, 10:1 or 20:1 which reduce the peak levels accordingly. Compressors may be combined with dynamic range expanders which suppress low level signals below a threshold according to a 1:2 or 1:20 ratio, the latter being called a gate because low level signals such as BACKGROUND NOISE are effectively eliminated.
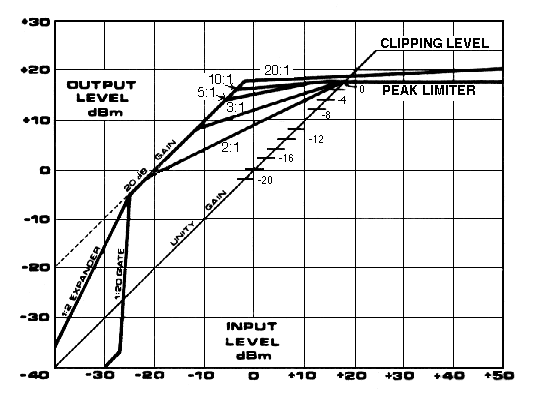
The relation of input level to output level in a compressor, limiter and expander showing patterns of amplification that affect dynamic range by departing from unity gain (1:1 ratio).
In popular music recording and commercial radio broadcasting, automatic compression brings peak intensities consistently to full MODULATION of the CARRIER. This is done, in part, to compensate for the inferior quality of most low cost radios and reproduction systems, and their inability to reproduce a wide range of frequencies and/or dynamics. A compressed signal will sound better than an uncompressed one on these receivers. Full modulation of the signal also effectively maximizes the physical area over which the signal may be received, thus ensuring the largest possible market audiences which may be offered to advertisers. Radio commercials, however, generally have a larger dynamic range, presumably to attract the listener's attention. See also: DAMAGE-RISK CRITERIA.
The following chart shows the intensity levels of four AM radio stations in Vancouver over an hour period, where the signal has been compressed to different extents such that the output rides near a maximum level. For comparison, the contours of a work by Debussy are shown.
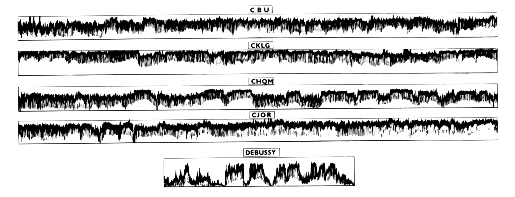
Radio intensity contours for a one-hour period compared with a segment of a CBC broadcast of Debussy's Nocturnes (from The Vancouver Soundscape, No. 2, Music of the Environment series, World Soundscape Project, 1974).
Compare: INTERFERENCE.
The LINEAR electrical combination of two or more AUDIO SlGNALs, such that the AMPLITUDE of each may be independently varied in its contribution to the overall output by means of a POTENTIOMETER. Non-linear mixing results in DISTORTION.
See: CROSS-FADE, FADE, MONTAGE, PAN. Compare: BLEND, DUBBING, HETERODYNE, LAW OF SUPERPOSITION, SEPARATION, SOUND-ON-SOUND, SPLICE. See also: EQUALIZATION, MONOPHONIC, SOUND SYNTHESIZER, STEREOPHONIC.
An instrument that measures and provides a graphic representation of the magnitude of an electrical signal and its time variation. Since this signal may represent an acoustic event, the record, in units of DECIBELs versus time, shows the amplitude ENVELOPE of the sound. Also called graphic level recorder.
See COMPRESSION, DRONE, ENVELOPE and STATIONARY SOUND for examples of level recordings.
Compare: OSCILLOSCOPE, SONOGRAPHY, SOUND ANALYSER, SOUND LEVEL METER, SPECTROGRAPH, diagram under TEMPO, VU METER.