
| Copyright© by Barry Truax (Handbook for Acoustic Ecology). | ||
Simple measurements of sound magnitude cannot deal with all of the environmental and communicational factors encountered in noise problems wherever they occur. Specialized measurement and evaluation systems have had to be developed which take a variety of additional factors into account, such as the frequency content and time-dependence of the noise, interference with speech communication, criteria for indoor environments intended for certain activities, evaluation of specific noise sources such as traffic and aircraft, establishing overall community noise impact, and so on.
In most cases, the pattern is to quantify the noise and correlate it to individual or community reaction, usually with the aim of establishing "acceptable" or "recommended" levels, or in some cases, in order to predict the impact of higher noise levels. The criteria arrived at are often used by various levels of government in establishing by-laws, standards and guidelines for noise control and abatement.
The specific case of damage-risk criteria for hearing protection in industry is considered under the larger topic of Audiology and Hearing Loss. Other noise measurement systems are presented here under the following general headings:
Most of the magnitudes used for general sounds can, of course, be applied to noise. There are other specific "level" measurements which usually are only used for noise.
A measure of SOUND PRESSURE LEVEL, given the symbol L. Various subscripts define the nature of the measurement, most commonly as follows:
L10: sound level exceeded 10% of the time (PEAK LEVEL)
L50: sound level exceeded 50% of the time (average or mean level)
L90: sound level exceeded 90% of the time (ambient level); see AMBIENT NOISE LEVEL
LA: sound level in DECIBELs measured on the A scale; see SOUND LEVEL METER
Ldn or LDN: day-night equivalent noise level; see EQUIVALENT ENERGY LEVEL
See: LOUDNESS LEVEL, NOISE, PERCEIVED NOISE LEVEL, SOUND LEVEL, TRAFFIC NOISE INDEX. Compare: DAMAGE-RISK CRITERIA, HEARING LEVEL.
The average INTENSITY over a given period of time, given the symbol Leq and expressed in DECIBELs relative to the reference intensity of the THRESHOLD OF HEARING.
The number of hours over which the average is taken is often put in brackets, e.g. Leq (24) denoting the 24-hour energy average. When nighttime levels (from 2200 to 0700) are given a 10 dB boost in calculating the 24-hour average (to compensate for sleep disturbance), the level is called the day-night equivalent noise level and is given the symbol Ldn. By counting loudness and duration, Leq is often called the exposure level.
Note that Leq is not identical with the average dB level (L50), although it will be similar when the fluctuation in dB is small (i.e. less than 5 dB). For greater fluctuations, Leq is higher, since the measurement method gives greater weight to higher intensities. For instance, the decibel average of three measurements of 20, 50 and 80 dBA is 50 dBA, but Leq = 75 dBA. As a result, the measurement is generally regarded as the best indicator of the effects of duration and loudness.
An Leq(24) of 70 has come to be regarded as the noise exposure threshold of hearing damage (see DAMAGE-RISK CRITERIA). Ldn = 55 similarly is regarded as the threshold of expressed community annoyance because it has been found to be the level for which 17% of the population will express a high degree of annoyance. Correlation of exposure levels with annoyance is extremely difficult as it depends on such factors as the relation between the person and the noise maker, individual listening habits, education and life style, attitudes towards the necessity or preventability of the noise (including opinions as to the intentions of the noise maker), previous noise exposure, and the means available for complaint.
Compare: COMMUNITY NOISE EQUIVALENT LEVEL, NOISE AND NUMBER INDEX, NOISE LEVEL, NOISE POLLUTION LEVEL, SOUND LEVEL, SOUND LEVEL METER, SOUND POWER LEVEL, SOUND PRESSURE LEVEL, TRAFFIC NOISE INDEX.
A scale developed originally by K.D. Kryter in 1959 to attempt to measure the perceived noisiness of jet aircraft by observers on the ground. The scale has been adopted by the International Standards Organization for international use.
As jet engines were perceived to be noisier than propeller aircraft because of differences in the SPECTRUM of the noise they produce, the method followed a similar approach to LOUDNESS summation of COMPLEX TONEs. Using EQUAL LOUDNESS CONTOURS, Kryter converted the decibel scale into a series of increments, to which he gave the unit of the NOY. From the chart at the right of the graph, the noy scale can be converted into PNdB. The equation expressing this relationship (analogous to the relation between the PHON and SONE) is:
PNdB = 40 + 10 log2 (noy)
The DECIBEL scale at the left of the graph is for FLAT response. In converting decibels on the A WEIGHTING NETWORK to PNdB, a very rough method is to add 12 dB; thus 100 dBA = 112 PNdB. The tendency at present is for many airports 'theoretically' to accept 110-112 PNdB for daytime flights and 100 PNdB for night flights; but these limits are more generally theoretical than actual, and they are still very high.
See also: EFFECTIVE PERCEIVED NOISE LEVEL, NOISE AND NUMBER INDEX, NOISE EXPOSURE FORECAST. Compare: COMMUNITY NOISE EQUIVALENT LEVEL, NOISE LEVEL, NOISE POLLUTION LEVEL, SOUND LEVEL.
The exact method of calculating noys is analogous to that of loudness index summation described under LOUDNESS and Appendix F. See also: LOUDNESS LEVEL.
Contours of perceived noisiness (from ISO recommendation R507, 1966).
Ref.: K.D. Kryter, "The Meaning and Measurement of Perceived Noise Level," Noise Control 6:5, Sept.-Oct., 1960, pp. 12-17; K.D. Kryter, "Scaling Human Reaction to Sound from Aircraft," Journal of the Acoustical Society of America, vol. 31, 1959, p.1415; I.S.O. Recommendation No. R507.
A noise measurement system based on curves introduced by Leo Beranek in 1952 dealing with acceptable levels for indoor speech communication.
See: NOISE CRITERION, NOISE RATING. Compare: ARTICULATION INDEX, SPEECH INTERFERENCE LEVEL.
A measurement, expressed as a number between 0 and 1, of the intelligibility of transmitted or processed speech or speech fragments, taking into account the SIGNAL-TO-NOISE RATIO in each of twenty speech bands.
Below 0.1, speech is considered unintelligible; above 0.6 intelligibility is acceptably high. The MASKing of onset TRANSIENTs by REVERBERATION reduces the AI by at least 0.1 for each second of reverberation time.
Compare: SPEECH communication CRITERION, SPEECH INTERFERENCE LEVEL.
A measure of the degree to which background noise interferes with or MASKs speech. It is obtained by averaging the SOUND PRESSURE LEVELs in the octave frequency bands centred on 500, 1000, 2000 and 4000 Hz, or by taking the A-weighted SOUND LEVEL (see SOUND LEVEL METER).
The spectrum of speech sound, however, is distributed over a wide range of 100 to 10,000 Hz, with the range from 200 to 6000 Hz being critical for full intelligibility. HEARING LOSS with age (PRESBYCUSIS) or noise-exposure (see THRESHOLD SHIFT) can also interfere with speech communication.
See also: REVERBERATION, SPEECH communication CRITERION, TRANSIENT. Compare: NOISE CRITERION, NOISE RATING, SOUND TRANSMISSION CLASS.
However, in the situation with face-to-face conversation of non-familiar speech material, the following chart shows the speech interference level of background noise for men with average voice strengths. At levels above 50 dBA, people raise their voice level as shown by the "expected" line if communication is not vital, or by the "communicating" line if it is. In the lower left hand area, normal voice levels are possible with an ARTICULATION INDEX of 0.5 and 98% sentence intelligibility; the area of the upper right hand corner denotes situations where unaided voice communication is impossible.
For telephone conversations, the following ranges apply: 60 dB or less as satisfactory, 60-75 dB as making telephone use difficult, and over 75 dB as unsatisfactory.

Necessary voice levels as limited by ambient noise for selected distances between speaker and listener for satisfactory face-to-face communication (from J.C. Webster, "Speech Interference by Noise," Proceedings, Inter-Noise 74, Institute of Noise Control Engineering, p. 558, used by permission of the author).
A noise measurement system for continuous or ambient noise in indoor environments proposed by Leo Beranek in 1971. See NOISE CRITERION for a detailed discussion.
A noise rating system introduced by Leo Beranek in 1957 to take into account the distribution of noise energy in various frequency bands. It has since been superseded by the NOISE RATING method which functions on similar principles. A comparison of acceptable levels for residential bedrooms would be NC 25 - 35 and NR 25. Both of these are in the range of 30 dBA. The original noise criterion curves applied to continuous sounds in indoor environments, and took speech communication into consideration.
In 1971, Preferred Noise Criterion curves (PNC) were published, in which allowable levels for low and high frequency noise were lowered. The new PNC curves apply to steady AMBIENT NOISE LEVELs in enclosed spaces, and are often used to judge the acceptability of ventilation and other background broad band noise.
See also: INFRASONIC, MASKING. Compare: SPEECH communication CRITERION, SPEECH INTERFERENCE LEVEL.
Representative recommended PNC levels and their dBA equivalents (see SOUND LEVEL, SOUND LEVEL METER) are:
PNC |
dBA |
|
| Excellent listening conditions | less than 20 | less than 30 |
| Sleeping, residential, private office, library & classroom spaces | 25 - 40 |
34 - 47 |
| Large offices, stores, cafeterias and restaurants | 35 - 45 |
42 - 52 |
| Lobbies, laboratory, engineering and secretarial spaces | 40 - 50 |
47 - 56 |
| Maintenance, equipment, kitchen and laundry rooms | 45 - 55 |
52 - 61 |
| Shops, garages, power-plant control rooms, etc. | 50 - 60 |
56 - 66 |
From the table and curves, it can be seen that the equivalent allowed noise levels rise with lower frequencies. This can in part be attributed to the ear's decreasing sensitivity to low frequency sound (see EQUAL LOUDNESS CONTOURS). However, these levels allow exposure to very low frequency and INFRASONIC vibration, which have been shown to be the cause of various physical and psychological disorders.
As a verification of their criteria, the authors report that measurements in auditoria and offices which the occupants find satisfactory fall in the appropriate PNC range. Being generally inaudible, infrasonic vibrations are not likely to provoke conscious awareness, despite their ability to cause involuntary physiological effects. Therefore, PNC-type criteria provide no protection for low frequency sound exposure, and further, tend to rely on the public's increasing toleration of background noise and what seems to be decreasing auditory skills. Compare: SOUND INTRUSION, SOUND POLLUTION.
Centre frequency (Hz)
31.5 |
63.0 |
125 |
250 |
500 |
1000 |
2000 |
4000 |
8000 |
|
PNC - 15 |
58 |
43 |
35 |
28 |
21 |
15 |
10 |
8 |
8 |
PNC - 20 |
59 |
46 |
39 |
32 |
26 |
20 |
15 |
13 |
13 |
PNC - 25 |
60 |
49 |
43 |
37 |
31 |
25 |
20 |
18 |
18 |
PNC - 30 |
61 |
52 |
46 |
41 |
35 |
30 |
25 |
23 |
23 |
PNC - 35 |
62 |
55 |
50 |
45 |
40 |
35 |
30 |
28 |
28 |
PNC - 40 |
64 |
59 |
54 |
50 |
45 |
40 |
35 |
33 |
33 |
PNC - 45 |
67 |
63 |
58 |
54 |
50 |
45 |
41 |
38 |
38 |
PNC - 50 |
70 |
66 |
62 |
58 |
54 |
50 |
46 |
43 |
43 |
PNC - 55 |
73 |
70 |
66 |
62 |
59 |
55 |
51 |
48 |
48 |
PNC - 60 |
76 |
73 |
69 |
66 |
63 |
59 |
56 |
53 |
53 |
PNC - 65 |
79 |
76 |
73 |
70 |
67 |
64 |
61 |
58 |
58 |
Octave-band SPL values associated with the recommended 1971 preferred noise criterion (PNC) curves (from Beranek, Blazier and Figwer, J.A.S.A., 1971, p. 1226, used by permission of the authors).
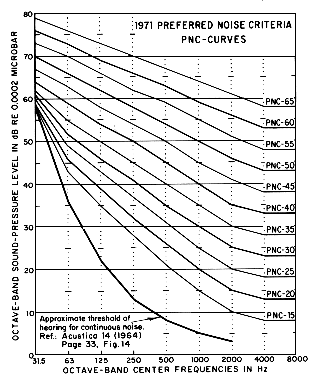
Preferred Noise Criterion curves. From: Beranek, Blazier and Figwer, "Preferred Noise Criterion (PNC) curves and their application to rooms", Journal of the Acoustical Society of America, vol. 50, p.1226, 1971, used by permission of the authors.
A method for rating the acceptability of indoor environments for the purposes of hearing preservation, speech communication and annoyance, based on curves developed by Kosten and van Os (1962).
SOUND PRESSURE LEVELs measured in octave bands are compared with these curves from which a noise rating (NR) is obtained. It will be seen that higher frequencies (where the ear is more sensitive) are given heavier noise ratings than lower ones, information not taken into consideration in strict DECIBEL measurements.
Compare: EQUAL LOUDNESS CONTOURS, SOUND LEVEL, SOUND LEVEL METER.
Acceptable NR values for various environmental situations have also been obtained, along with correction factors for variations.
Compare: COMMUNITY NOISE EQUIVALENT LEVEL, NOISE AND NUMBER INDEX, NOISE CRITERION, NOISE EXPOSURE FORECAST, NOISE LEVEL, NOISE POLLUTION LEVEL, PERCEIVED NOISE LEVEL, SPEECH communication CRITERION, SPEECH INTERFERENCE LEVEL.

Noise rating curves. The individual noise rating (NR) curves are identified by the numerals along the 1000 Hz line (from Kosten and van Os, "Community reaction criteria for external noises," National Physical Laboratory Symposium, No. 12, 1962, p. 377, London H.M.S.O., used by permission).
Area |
Criterion |
Correction for dwellings |
Correction in dB |
| Broadcasting studio | 15 |
Pure tone, easily perceptible | - 5 |
| Concert hall, legitimate theatre, 500 seats | 20 |
Impulsive and/or intermittent | - 5 |
| Classroom, music room, TV studio, conference room | 25 |
Noise only during working hours | + 5 |
| Sleeping room (see corrections at right) | 25 |
Noise during 25% of the time | + 5 |
| Conference room, 20 seats or with public address system; cinema, hospital, church, courtroom, library | 30 |
Noise during 6% of the time | + 10 |
| Living room (see corrections at right) | 30 |
Noise during 1.5% of the time | + 15 |
| Private office | 40 |
Noise during 0.5% of the time | + 20 |
| Restaurant | 45 |
Noise during 0.1% of the time | + 25 |
| Gymnasium | 50 |
Noise during 0.02% of the time | + 30 |
| Office (typewriters) | 55 |
Economic tie | + 5 |
| Workshop | 65 |
Very quiet suburban | - 5 |
| Suburban | 0 |
||
| Residential urban | + 5 |
||
| Urban, near some industry | + 10 |
||
| Area of heavy industry | + 15 |
and their correlation to public annoyance
Originally devised by the Wilson Committee on Noise in Britain (1963), the Noise and Number Index is an attempt to measure the subjective noisiness of aircraft. It uses the PNdB as a basis and additionally takes into account the number of aircraft per day (or night) as a key annoyance factor. The NNI formula is as follows:
NNI = (Average Peak PNdB) + 15 (log10 N) - 80
where N is the number of aircraft, the average peak PNdB is a logarithmic average of the highest levels of all overflights, and 80 is the value subtracted to take into account the findings of social surveys which showed that the annoyance factor was zero at 80 PNdB (see graph below).
See: NOISE EXPOSURE FORECAST, PERCEIVED NOISE LEVEL. Compare: TRAFFIC NOISE INDEX.
If the number of flights is known, PNdB may be converted to NNI quite easily. For instance, assuming an average peak of 105 PNdB (approx. 92 dBA) and the total number of flights to be 140, the conversion would be as follows:
NNI = 105 PNdB + 15 (log10 140) - 80
= 105 + 15 (2.146) - 80
= 105 + 32 - 80
NNI = 57
The Noise and Number Index scale runs from 0 - 60 and following the results of social surveys, the Wilson Committee assigned values of annoyance to the index as shown in the graph below. The Wilson Committee considered that exposure to aircraft noise reaches an unreasonable level in the range 50 - 60. A difference of 10 NNI corresponds either to an increase of the peak level of 10 PNdB or to a quadrupling of the number of flights in the period. Compare chart under COMMUNITY NOISE EQUIVALENT LEVEL. See also: SOUND INTRUSION.
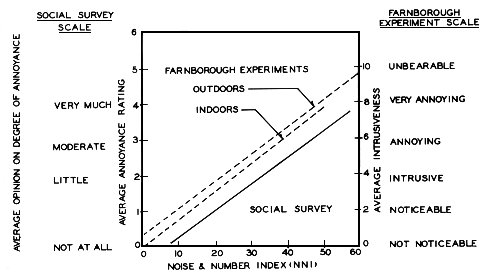
Relations between annoyance rating and Noise and Number Index obtained from social survey and Farnborough experiments. From: Wilson Committee on the Problem of Noise, Noise: Final Report, Cmnd 2056, London, HMSO, 1963, p. 208, used by permission.
A method, developed by the U.S. Federal Aviation Agency to predict the degree of community annoyance from aircraft noise (and airports) on the basis of various acoustical and operational data. As such it is not a consistent index for all environmental health problems. It is applied to determine acceptable levels for various community zoning regions.
For instance, a residential area should have a NEF of 30 or less; between 30 and 40 NEF is stated as suitable for multiple family housing, although it is not clear why a higher tolerance level should apply in this case; above NEF 40, the area is suitable for industrial and recreational purposes only.
The calculation is based on EFFECTIVE PERCEIVED NOISE LEVELs (in EPNdB) for various aircraft, and considers all aspects of flight operation and time of day (weighting night occurrences heavier than daytime ones). However, weather conditions and background noise levels are not considered as yet. Increased public awareness, and subsequent decrease in tolerance of aircraft and other environmental noise, demands continual reassessment of methods such as the NEF.
See: JET PAUSE, SOUND INTRUSION.
The measurement is based on the following equation:
NEF = EPNL + 10 log10 (ND + 16.7 NN ) - 88 (dB)
where EPNL is the energy mean value of the EPNL (see EFFECTIVE PERCEIVED NOISE LEVEL for method of tone and duration correction) and ND and NN are the number of flights during the day (0700 to 2200) and night (2200 to 0700) respectively. The factor 16.7 represents a 10-to-1 weighting of night flights over day ones.
In some places, the NEF has superseded the CNR system (see COMPOSITE NOISE RATING) but because it requires complex computer calculations, another system, the CNEL (see COMMUNITY NOISE EQUIVALENT LEVEL), has been developed based on normal dBA readings. In practice, CNEL values are higher than NEF by 35 ± 2 dB.
The approximate relation of NEF to CNR and NNI (see NOISE AND NUMBER INDEX) is:
NEF = CNR - 72
NEF = NNI - 16
A U.S. noise measurement system introduced in the early 1960's, and designed to evaluate land use near airports and predict annoyance levels from aircraft operations. Although still in use, the CNR has been superseded in some places by the more recent NOISE EXPOSURE FORECAST (NEF) system (which is similar but adds corrections for duration and pure tones) and the COMMUNITY NOISE EQUIVALENT LEVEL (which is based on dBA readings to avoid computer calculation).
The measurement is based on the maximum PERCEIVED NOISE LEVEL (PNLmax) in PNdB plus consideration of the number of flights during the day and night. The basic equation is:
CNR = PNLmax + 10 log10 (ND + 16.7 NN) - 12 (dB)
where PNLmax is the approximate energy mean of the maximum perceived noise levels at a given point, and ND and NN are the number of flights during the day (0700 to 2200) and night (2200 to 0700) respectively. The factor 16.7 represents a 10-to-1 weighting of night flights over day ones.
In general, the CNR is related to the NEF and the NNI (see NOISE AND NUMBER INDEX) by the constant values:
CNR @ NEF + 72
CNR @ NNI + 56
As observed by R.A. Barron, in The Tyranny of Noise (p. 50), the CNR "supposedly predicts whether a given noise will lead to no response, or provoke a rising degree of protest, culminating in vigorous legal action. (quoting L. Goodfriend) 'The objective is not to produce an enjoyable or even a suitable environment. It is merely to prevent complaints.' " See: SOUND INTRUSION.
A modification of the PERCEIVED NOISE LEVEL to take into account tone components in aircraft broad band noise, as well as the duration of the noise. It is measured in EPNdB, and defined as the Perceived Noise Level (PNL) in PNdB plus a tone correction and a duration correction. It is in general use by the U.S. Federal Aviation Administration in aircraft certification.
The EPNL measurement is based on the following equation:
EPNL= PNLmax+ 10 log (t10/20) + F (dB)
where PNLmax is the maximum perceived noise level during flyover in PNdB, t10 is the duration (in seconds) of the noise level within 10 dB of the peak PNL, and F is a correction for PURE TONEs (which are generally found to be more annoying than broad band noise without perceived tones). In practice, F is about +3 dB.
The NOISE EXPOSURE FORECAST (NEF) is based on EPNL measurement and thus requires computer calculation.
A method devised in the U.K. to measure annoyance responses to motor vehicle noise. It takes into account the traffic flow and therefore functions similarly to the NOISE AND NUMBER INDEX used to evaluate aircraft noisiness.
Traffic levels are monitored over a 24-hour period and TNI is derived by combining the NOISE LEVELs exceeded in dBA 10 per cent and 90 per cent of the time. This takes into account the very noisy vehicles weighted against the general traffic noise.
Compare: EQUIVALENT ENERGY LEVEL, NOISE POLLUTION LEVEL.
The TNI is computed from the formula:
TNI = 4 . (L10 - L90) + (L90 - 30) (dB)
where L10 and L90 are the A-weighted DECIBEL levels exceeded 10% and 90% of the time respectively (i.e. the peak and ambient levels respectively).
For example, if L10 is 59 dBA and L90 is 44 dBA, the TNI would be 74 dB, a level found in social surveys to produce less than 3% dissatisfaction, and therefore a level suggested for planning purposes with regard to determining an optimum distance for dwellings from roadways.
Ref.: F.J. Langdon and W.E. Scholes, The Traffic Noise Index: A Method of Controlling Noise Nuisance, Building Research Station Current Papers 38168, April 1968, pp. 2-3.
A noise measurement procedure recently introduced in the U.S. in an attempt to relate various earlier studies of community NOISE. The measurement is conceived so that it combines the AMBIENT NOISE LEVEL with the degree of steadiness in time of the noise (assuming that the less steady it is, the more distracting and annoying it becomes). The basic definition is:
LNP = Leq + ks
where Leq is the EQUIVALENT ENERGY LEVEL measured in dBA or PNdB, k is a constant which is provisionally given the value 2.56, and s is the standard deviation of instantaneous levels in time. This measurement system applies to any environment, unlike those specifically concerned with aircraft and traffic. As a result, however, it is incapable of determining whether the noise being measured is wanted or unwanted sound.
See also: NOISE LEVEL, NOISE POLLUTION. Compare: TRAFFIC NOISE INDEX.
Ref.: D.W. Robinson, "Towards a Unified System of Noise Assessment," Journal of Sound and Vibration, vol. 14, 1971, pp. 279-98.
A noise measurement system introduced in the early 1970's by the State of California as a simplified alternative to the NEF system (see NOISE EXPOSURE FORECAST) for community noise exposure, with particular emphasis on airport noise. The major difference is that CNEL can be measured using ordinary dBA readings (see SOUND LEVEL METER), as opposed to the computer calculation of EFFECTIVE PERCEIVED NOISE LEVEL used in the NEF.
As well, the CNEL system gives a higher weighting to evening flights (1900 to 2200) and includes a table of corrections (see below) based on seasonal, residential type, previous community noise experience and pure tone/impulse differences. In practice, CNEL values are comparable to NEF and exceed them by 35 ± 2 dB. The total noise exposure per day (CNEL) is calculated from the equation:
CNEL = SENEL + 10 log10 (ND + 3NE + 10NN) - 49.4 (dB)
where ND, NE and NN are the number of flights during the day (0700 to 1900), evening (1900 to 2200) and night (2200 to 0700) respectively, and SENEL is the energy mean value of the single event noise exposure level which may be calculated from the equation:
SENEL = NLmax+10 log10tea (dB)
where NLmax is the maximum noise level in dBA and tea, is the effective time duration (in seconds) of the noise level (on the A scale) and is approximately equal to one-half of the duration during which the noise level is within 10 dB of the maximum.
The above expressions are simplifications of the actual procedure and only apply to a single type of aircraft and single flight path. An hourly average of the noise level (HNL) including number of flights per hour N is also used and defined as:
HNL = SENEL + 10 log10N - 35.6 (dB)
A variation in the calculation uses the first equation above but counts the flights as in the NEF system (without evening specification). The normalized CNEL uses the corrections listed in the table below (see also SOUND INTRUSION). Correlation to community reaction is shown in the following chart for the CNEL scale (with approximate CNR and NEF values).
Compare: NOISE AND NUMBER INDEX, NOISE CRITERION, NOISE EXPOSURE FORECAST, NOISE LEVEL, NOISE POLLUTION LEVEL, NOISE RATING, PERCEIVED NOISE LEVEL, SPEECH INTERFERENCE LEVEL.
| Type of Correction | Description |
Amount of Correction to be Added to Measured CNEL in dB |
| Seasonal Correction | Summer (or year-round operation) Winter only (or windows always closed) |
0 - 5 |
| Correction for Outdoor Residual Noise Level | Quiet suburban or rural community (remote from large cities and from industrial activity and trucking) | +10 |
| Normal suburban community (not located near industrial activity) | +5 |
|
| Urban residential community (not immediately adjacent to heavily traveled roads and industrial areas) | 0 |
|
| Noisy urban residential community (near relatively busy roads or industrial areas) | -5 |
|
| Very noisy urban residential community | -10 |
|
| Correction for Previous Exposure & Community Attitudes | No prior experience with the intruding noise | +5 |
| Community has had some previous exposure to intruding noise but little effort is being made to control the noise. This correction may also be applied in a situation where the community has not been exposed to the noise previously, but the people are aware that bona fide efforts are being made to control the noise. | 0 |
|
| Community has had considerable previous exposure to the intruding noise and the noisemaker's relations with the community are good. | -5 |
|
| Community aware that the operation causing noise is very necessary and it will not continue indefinitely. This correction may be applied for an operation of limited duration and under emergency circumstances. | -10 |
|
| Pure Tone or Impulse | No pure tone or impulsive character | 0 |
| Pure tone or impulsive character present | +5 |
Table of correction factors used to normalize CNEL values (after U.S. Environmental Protection Agency document NTID300.3, Community Noise, 1971).

Community reaction to noise as a function of normalized CNEL values as calculated from case histories (after U.S. Environmental Protection Agency document NTID 300.3, Community Noise, 1971).
as criteria for sound insulation.
The loss or dissipation of sound energy in passing through a material or on striking a surface, usually through conversion to heat energy. The term may also refer to the property of a medium, material or object to DAMP sound energy. That part of the sound striking a surface which is not absorbed is either reflected or transmitted.
See: INCIDENCE, REFLECTION, REVERBERATION, SOUND PROPAGATION, SOUND SHADOW, TRANSMISSION.
The absorption process can be measured quantitatively (see ABSORPTION COEFFICIENT) and is of importance in the interior design of concert halls and recording studios, etc. The unit used is the absorption power of 1 square foot of open window space, called the sabin, (which reflects no sound and therefore is a perfect unit of absorption). Some examples of absorption capability of various surfaces are:
ABSORPTION (in Sabins)
at frequency (Hz)
|
Individual object |
128 |
256 |
512 |
1,024 |
2,048 |
4,096 |
Author |
|---|---|---|---|---|---|---|---|
| Audience, per person with coat | 2.3 |
3.2 |
4.8 |
6.2 |
7.6 |
7.0 |
B.S. |
| Auditorium chairs, wood | 0.15 |
0.22 |
0.25 |
0.28 |
0.50 |
---- |
P.S. |
| Auditorium chairs, upholstered | ---- |
3.1 |
3.0 |
3.2 |
3.4 |
---- |
F.W. |
B.S.: Bureau of Standards; P.S.: P.E. Sabine; F.W.: F.R. Watson
Absorption units of various objects as a function of frequency (after Olson, Music, Physics and Engineering, Dover, 1967, p. 271, used by permission).
The fraction of energy which is absorbed on striking any surface. It therefore takes values between 0 and 1, and is usually frequency dependent. In room ACOUSTICS, this coefficient, given the symbol a, is expressed as a fraction of the perfect ABSORPTION at an open window of equal area. A table such as the following might be consulted for choosing suitable materials for SOUND INSULATION in a room or building.
Compare: NOISE REDUCTION COEFFICIENT, NOISE REDUCTION FACTOR, SOUND TRANSMISSION COEFFICIENT. See also: REFLECTION COEFFICIENT, REVERBERATION, SOUNDPROOF.
Chart of Absorption Coefficients
| Material | 128 Hz |
256 Hz |
512 Hz |
1,024 Hz |
2,048 Hz |
4,096 Hz |
Author |
| Draperies hung straight, in contact with wall, cotton fabric, 10 oz. per square yard | 0.04 |
0.05 |
0.11 |
0.18 |
0.30 |
0.44 |
P.S. |
| The same, velour, 18 oz. per square yard | 0.05 |
0.12 |
0.35 |
0.45 |
0.40 |
0.44 |
P.S. |
| Same as above, hung 4 inches from wall | 0.09 |
0.33 |
0.45 |
0.52 |
0.50 |
0.44 |
P.S. |
| Felt, all hair, contact with wall | 0.13 |
0.41 |
0.56 |
0.69 |
0.65 |
0.49 |
P.S. |
| Rock wool (1 inch) | 0.35 |
0.49 |
0.63 |
0.80 |
0.83 |
------ |
V.K. |
| Carpet on concrete (0.4 inch) | 0.09 |
0.08 |
0.21 |
0.26 |
0.27 |
0.37 |
B.R. |
| Carpet, on 1/8 inch felt, on concrete (0.4 inch) | 0.11 |
0.14 |
0.37 |
0.43 |
0.27 |
0.27 |
B.R. |
| Concrete, unpainted | 0.010 |
0.012 |
0.016 |
0.019 |
0.023 |
0.035 |
V.K. |
| Wood sheeting, pine (0.8 inch) | 0.10 |
0.11 |
0.10 |
0.08 |
0.08 |
0.11 |
W.S. |
| Brick wall, painted | 0.012 |
0.013 |
0.017 |
0.020 |
0.023 |
0.025 |
W.S. |
| Plaster, lime on wood studs, rough finish (1/2 inch) | 0.039 |
0.056 |
0.061 |
0.089 |
0.054 |
0.070 |
P.S. |
P.S.: P.E. Sabine; V.K.: V.0. Knudsen; B. R.: Building Research Station, England; W.S.: Wallace Sabine.
Absorption coefficients for various building and insulation materials as a function of frequency (after Olson, Music, Physics and Engineering, Dover, 1967, p. 271, used by permission).
The ratio r of the amplitude of the reflected sound to the amplitude of the INCIDENT wave. It is related to the ABSORPTION COEFFICIENT a by the relation:
a = 1 - r2
See: REFLECTION. Compare: NOISE REDUCTION COEFFICIENT, SOUND TRANSMISSION COEFFICIENT.
A system of measuring the INSULATION properties of various floor and ceiling materials with respect to IMPACT SOUNDs such as footsteps. Difficulties in measurement have kept this system from being generally accepted.
Compare: ABSORPTION COEFFICIENT, NOISE ISOLATION CLASS, NOISE REDUCTION FACTOR, SOUND TRANSMISSION CLASS.
A system for the measurement of SOUND INSULATION properties of partitions between rooms or buildings, particularly in the case of speech or office noise interference.
Various partitions can be rank ordered on the basis of this measurement, which uses the TRANSMISSION loss of sound in the frequency range 125 to 4000 Hz. However, the measurement is not reliable for low frequency sound or INFRASONIC vibration.
Compare: ABSORPTION COEFFICIENT, IMPACT INSULATION CLASS, NOISE ISOLATION CLASS, SOUND TRANSMISSION COEFFICIENT, SOUND TRANSMISSION LOSS, SPEECH INTERFERENCE LEVEL.
The usage of materials in buildings to reduce the TRANSMISSION of sound between parts of the building, or between interior and exterior.
The term may also refer to the degree of effectiveness of insulating materials, as measured by the ABSORPTION COEFFICIENT, IMPACT INSULATION CLASS, NOISE ISOLATION CLASS, NOISE REDUCTION COEFFICIENT, NOISE REDUCTION FACTOR, SOUND TRANSMISSION CLASS, SOUND TRANSMISSION LOSS.
See also: ANECHOIC CHAMBER, SOUNDPROOF. Compare: SOUND SHADOW.
The ATTENUATION in DECIBELs created by ABSORPTION in any material or object placed between the source and the listener.
See: ABSORPTION COEFFICIENT, NOISE REDUCTION COEFFICIENT, SOUND INSULATION, SOUNDPROOF. Compare: SOUND PROPAGATION.
The average of the ABSORPTION COEFFICIENTs of a material used in SOUND INSULATION, measured at frequencies of 250, 500, 1,000 and 2,000 Hz.
Compare: IMPACT INSULATION CLASS, NOISE ISOLATION CLASS, NOISE REDUCTION FACTOR, REFLECTION COEFFICIENT, SOUND TRANSMISSION COEFFICIENT.
A method of measuring noise reduction dealing with the degree of isolation between two enclosed spaces that are connected acoustically by more than one path.
Compare: IMPACT INSULATION CLASS, NOISE REDUCTION COEFFICIENT, SOUND INSULATION, SOUND TRANSMISSION CLASS.
The fraction of the sound energy incident on a structure that is transmitted through it.
See: SOUND INSULATION, SOUND TRANSMISSION CLASS, TRANSMISSION. Compare: ABSORPTION COEFFICIENT, NOISE REDUCTION COEFFICIENT, REFLECTION COEFFICIENT.